Triberraar-pi-monitor
A simple websocket and angular based application to monitor a raspberry pi (2).
This project is maintained by triberraar
triberraar-pi-monitor
A simple websocket and angular based application to monitor a raspberry pi (2).
The following components are monitored:
- CPU
- Memory
- Network
- Storage
- Time
CPU
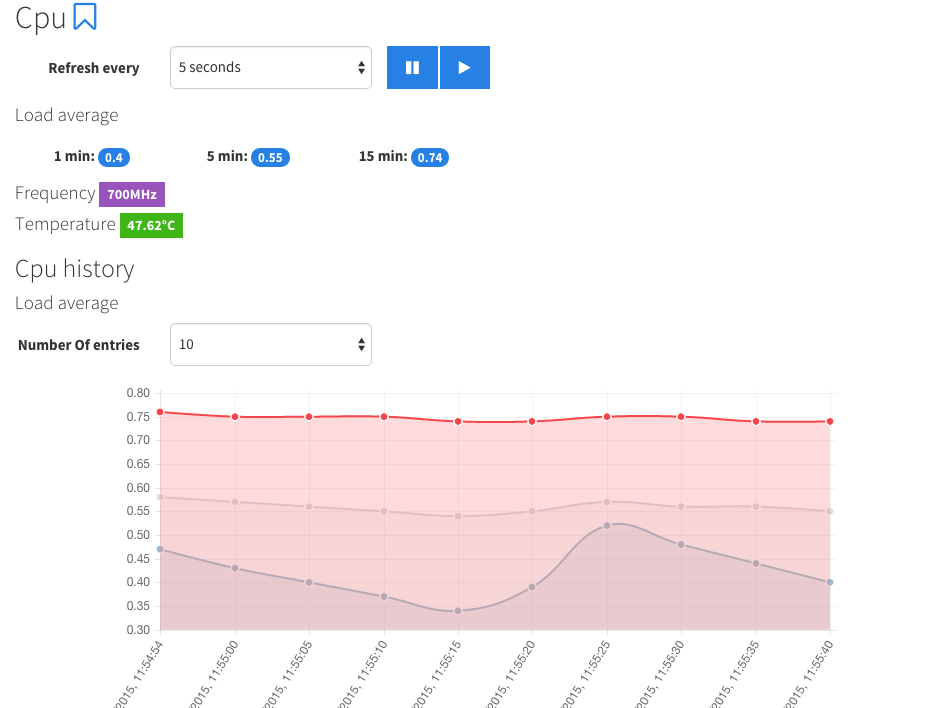
The average load, frequency and temperature are monitored. The average load and temperature are also plotted on a graph.
Memory
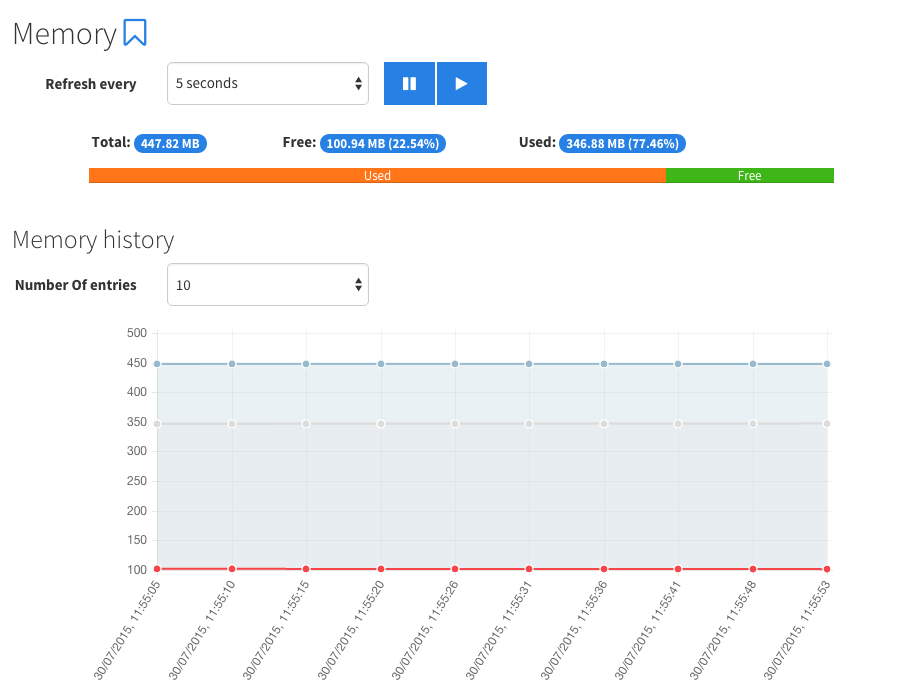
The total, free and used temperature are monitored and they are also plotted.
Network
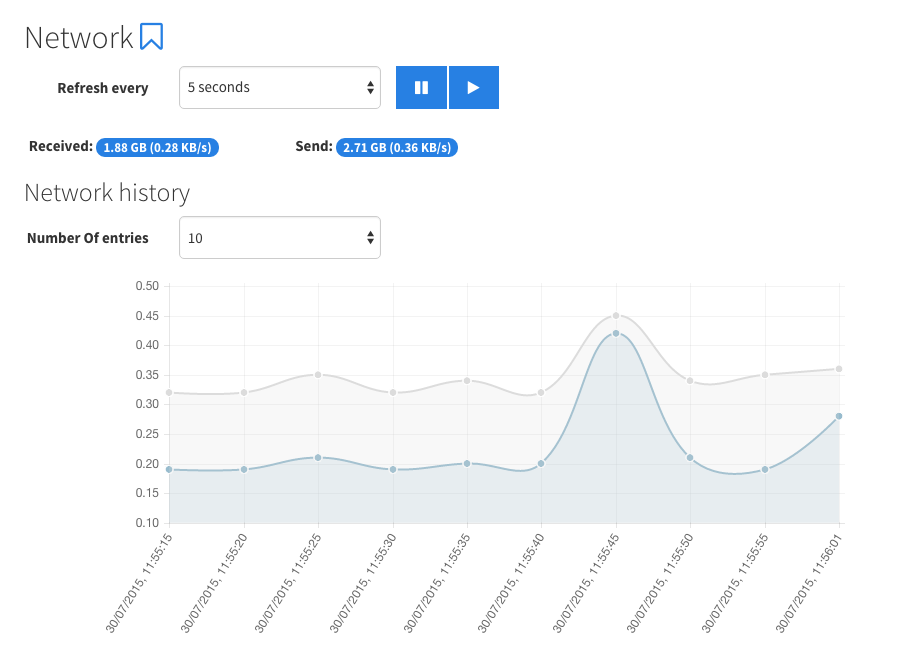
The received and transmitted kilobytes are monitored. The average speed during the last interval is also calculated. These speeds are also plotted.
Storage
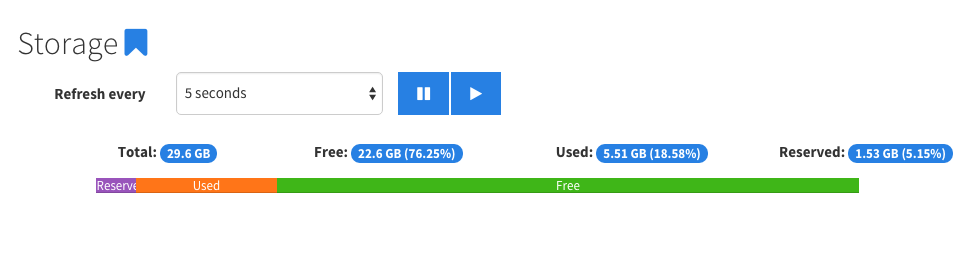
The total, used, reserved and free kilobytes of the root folder are monitored.
Time
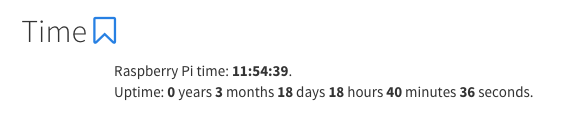
The current time and uptime of the raspberry pi are monitored.
Dashboard
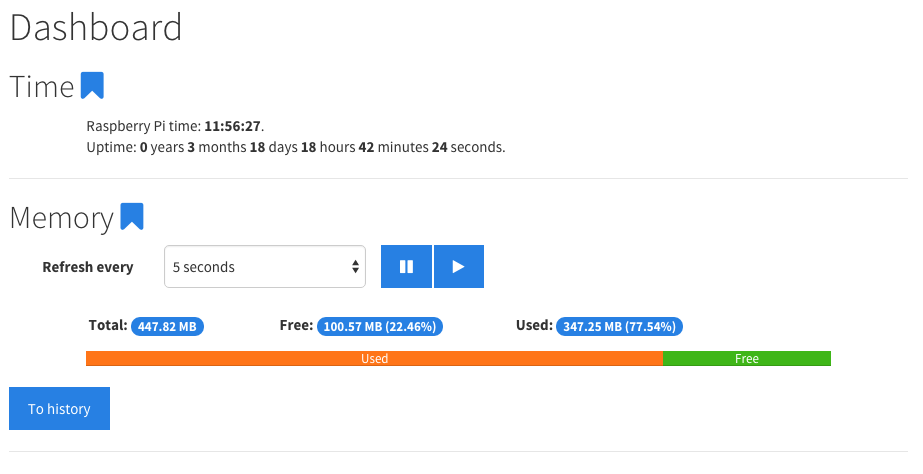
The dashboard is configurable and can contain all the above components. This configuration is saved in local storage.
Install
Please make sure node and npm are installed. Also install bower globally. Install by running
npm install
and
bower install
Installation done :)
Configuration
Configure the application in the config.json file. For the moment the only configuration is the port used (standard 7076).
Run
Run the application by executing
sudo node triberraar-pi-monitor.js
!!! Be sure to run as sudo as some functionality needs this !!!
Architecture
Back-end
The back-end is written in javascript using Node.js. It uses some supporting javascript libraries:
- express
- socket.io
- async
- lodash
- moment
The back-end provides both a JSON Rest-api and websocket communication. If an error occurs the rest api responds with 500 and looks like:
{
    "message": "The error message",
    "error": <the original error object>
}
If an error occurs during the websocket communication a response will look like this:
{
    "error": {
        "message": "The error message",
        "error": <the original error object>
    }
}
Temperatures are reported in degrees celcius. Sizes are reported in kilobytes. Frequency is reported in megahertz. Uptime is reported in seconds.
Front-end
The front-end is also written in javascript using AngularJS. It uses some supporting javascript libraries:
- socket.io-client
- angular-socket-io
- angular-ui-router
- moment
- lodash
- angular-chart.js
- angular-bootstrap
- ngstorage
- angular-growl-v2
Layout is done with Bootstrap and Font Awesome. The used theme is Cosmo.
The front-end provides a page per monitored component and history for some. There is also a configurable dashboard, that is saved into local storage.
Functionality
CPU
Commands
The cpu frequency is gathered by reading the '/sys/devices/system/cpu/cpu0/cpufreq/cpuinfo_cur_freq' file.
The load average is gathered by reading the '/proc/loadavg' file.
The temperature is gathered by reading the '/sys/devices/virtual/thermal/thermal_zone0/temp' file.
Rest
The cpu information can be queried on '/cpu' and looks like:
{
    "loadAvg":{
        "1min":0.4,
        "5min":0.47,
        "15min":0.45
    },
    "frequency":950,
    "temperature":48.15
}
Websocket
The cpu information can be queried by sending the 'cpu' message and looks like:
{
    "content": {
        "loadAvg":{
            "1min":0.4,
            "5min":0.47,
            "15min":0.45
        },
        "frequency":950,
        "temperature":48.15
    }
}
Memory
Commands
The memory information is gathered by reading the '/proc/meminfo' file.
Rest
The memory information can be queried on '/memory' and looks like:
{
    "total":447824,
    "free":51744,
    "used":396080
}
Websocket
The memory information can be queried by sending the 'memory' message and looks like:
{
    "content": {
        "total":447824,
        "free":51744,
        "used":396080
    }
}
Network
Commands
The network information is gathered by reading the '/sys/class/net/eth0/statistics/rx_bytes' and '/sys/class/net/eth0/statistics/tx_bytes' files.
Rest
The network information can be queried on '/network' and looks like:
{
    "rx":518892,
    "tx":518891.808
}
Websocket
The network information can be queried by sending the 'network' message and looks like:
{
    "content": {
        "rx":518892,
        "tx":518891.808
    }
}
Storage
Commands
The storage information is gathered by executing the 'df' command.
Rest
The storage information can be queried on '/storage' and looks like:
{
    "total":29630532,
    "used":4710528,
    "free":23391788,
    "reserved":1528216
}
Websocket
The storage information can be queried by sending the 'storage' message and looks like:
{
    "content": {
        "total":29630532,
        "used":4710528,
        "free":23391788,
        "reserved":1528216
    }
}
Time
Commands
The time information is gathered by reading the '/proc/uptime' file.
Rest
The time information can be queried on '/time' and looks like:
{
    "uptime":9524454970,
    "current":"2015-07-29T20:54:57.989Z"
}
Websocket
The time informationis emitted to all connected sockets every second and looks like:
{
    "content": {
        "uptime":9524454970,
        "current":"2015-07-29T20:54:57.989Z"
    }
}
TODO
- Prettier UI